Operations
These tabs provide a central location to view summary operations information regarding your AWS resources and provide access to your Connectria portal support tickets:
Dashboard
The dashboard tab provides overview and summary operations data points. Clicking into dashboard elements will typically take you to the Resources page to provide more detailed information.
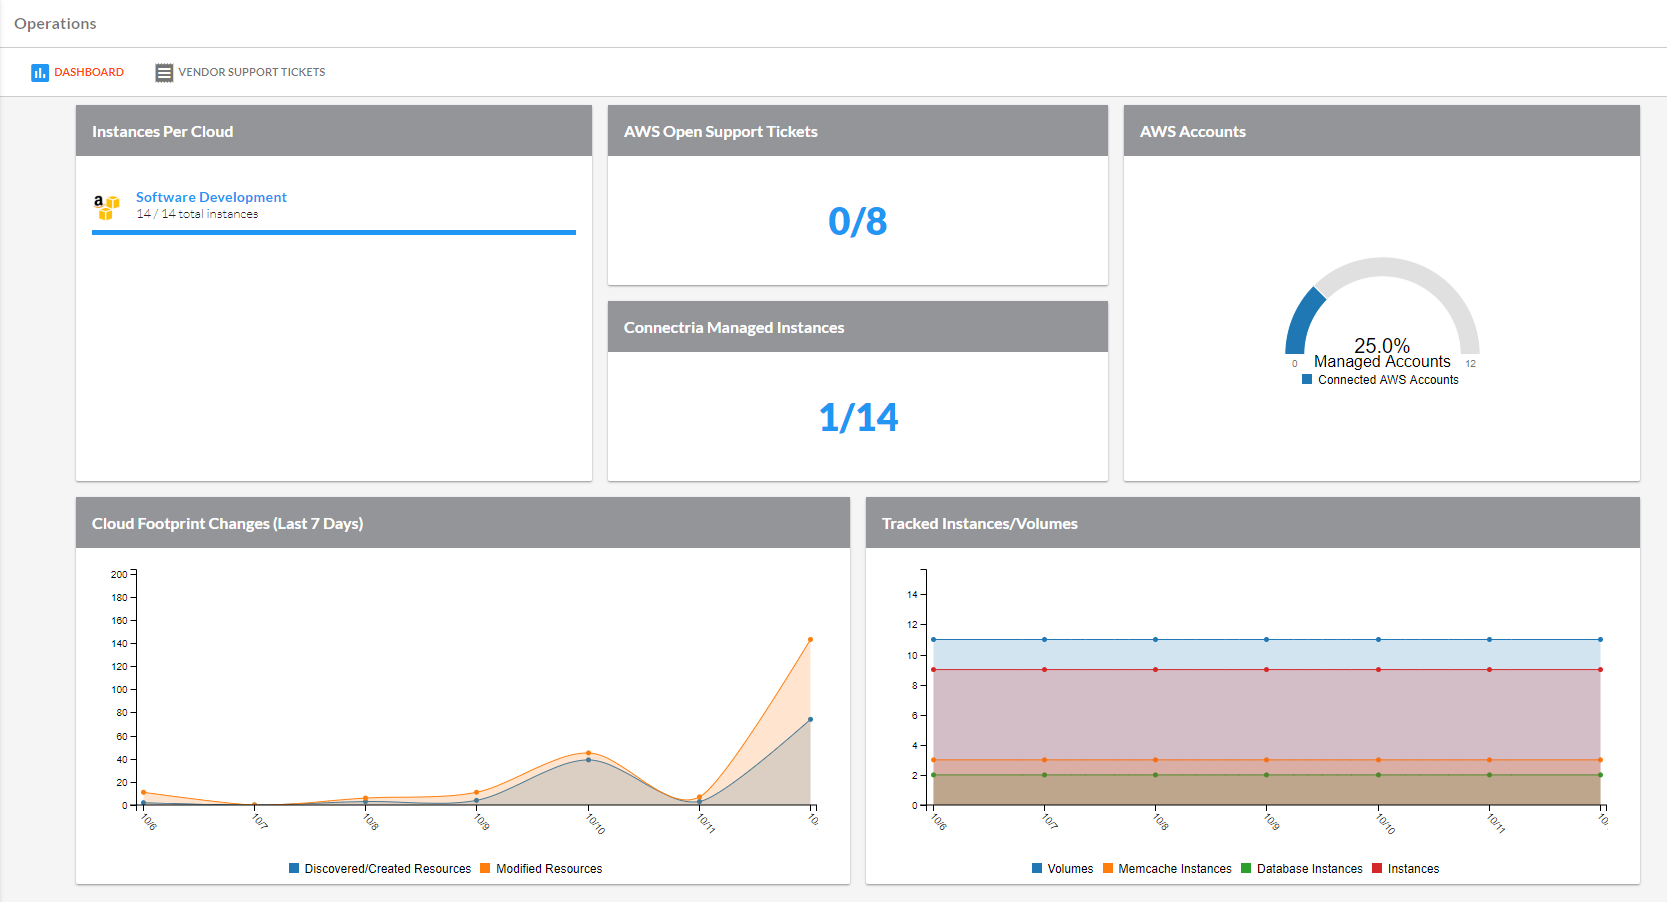
Dashboard page elements:
Instances Per Cloud
AWS Open Support Tickets
Total Managed Instances
AWS Accounts
Cloud Footprint Changes (Last 7 Days)
Tracked Instances/Volumes
AWS Support Tickets
The AWS Support Tickets tab displays tickets created from your AWS account(s).
Note
AWS Support Tickets are available only with at least AWS developer level support.
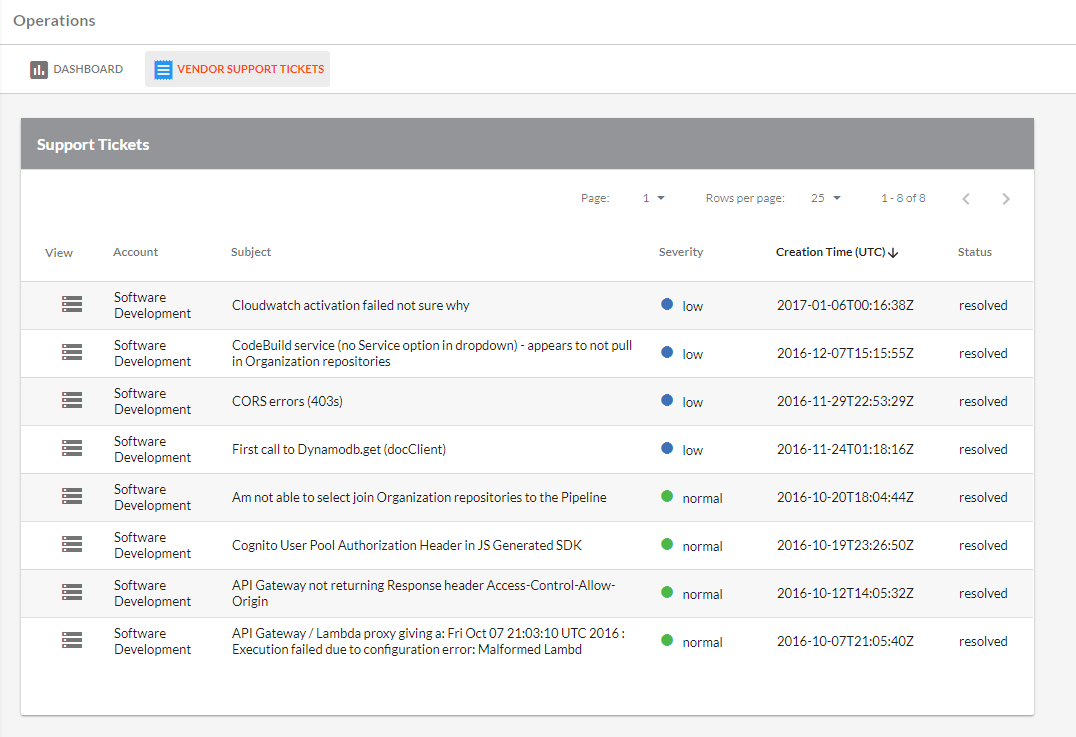
Here, users can see information regarding each ticket, including:
The cloud account the ticket is linked to.
The subject of the ticket.
The severity of the ticket given to it upon creation.
The time the ticket was created.
The current status of the ticket.
Note
Be aware that only tickets from the past 12 months will be pulled into the AWS Support Tickets page upon the initial configuration of the account in TRiA. After this initial pull, however, tickets older than 12 months will be still be viewable.
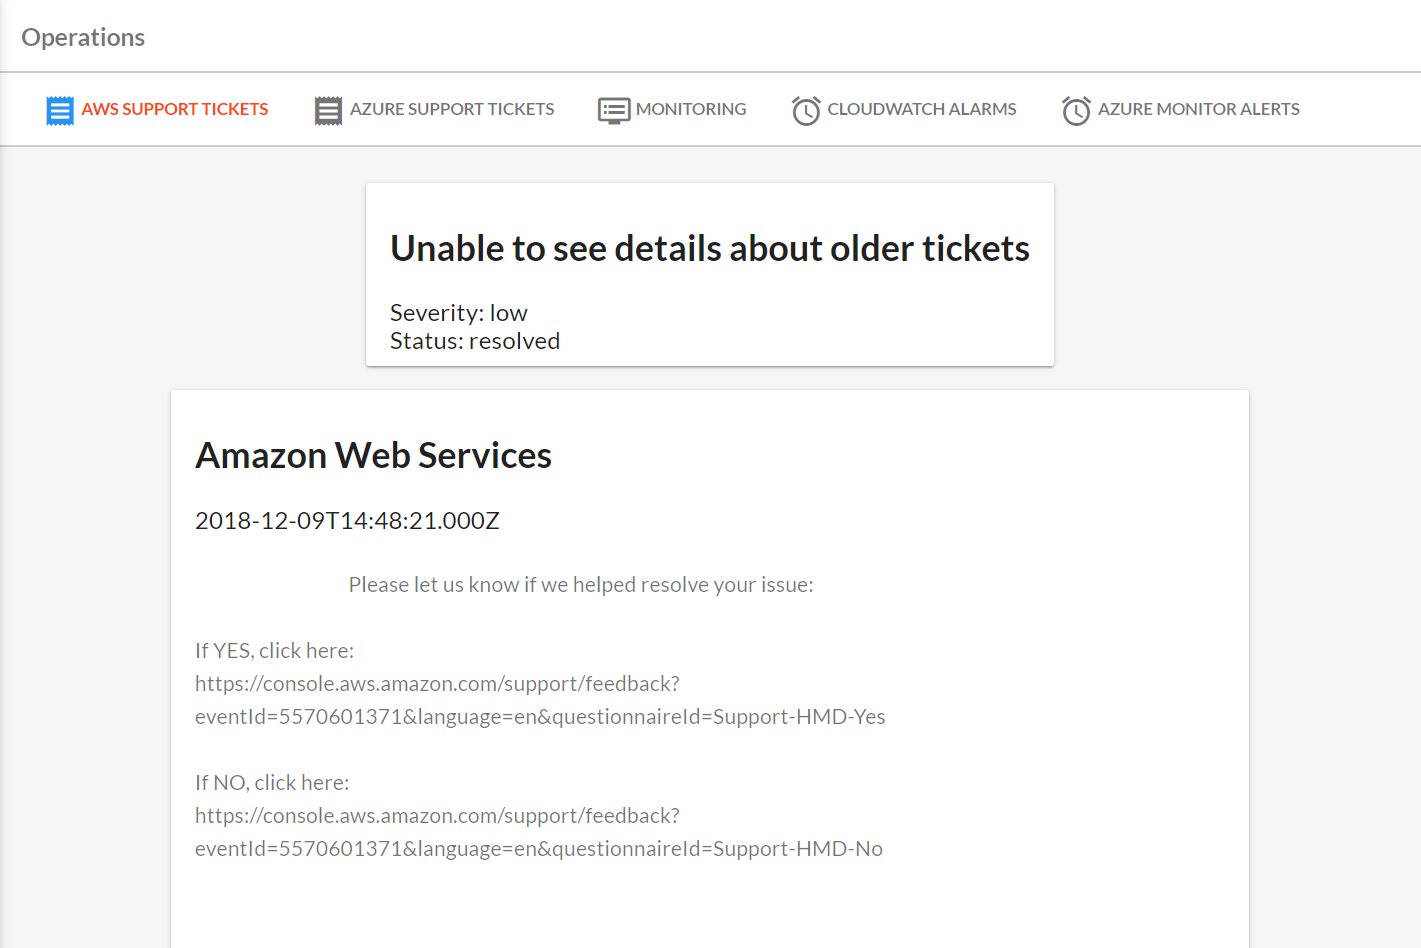
Clicking on the stack icon under View for a support ticket will display communications regarding that ticket.
CloudWatch Alarms
The CloudWatch Alarms tab displays the alarms for your AWS clouds created from your AWS account(s).
Note
CloudWatch Alarms is available only with at least AWS developer level support.
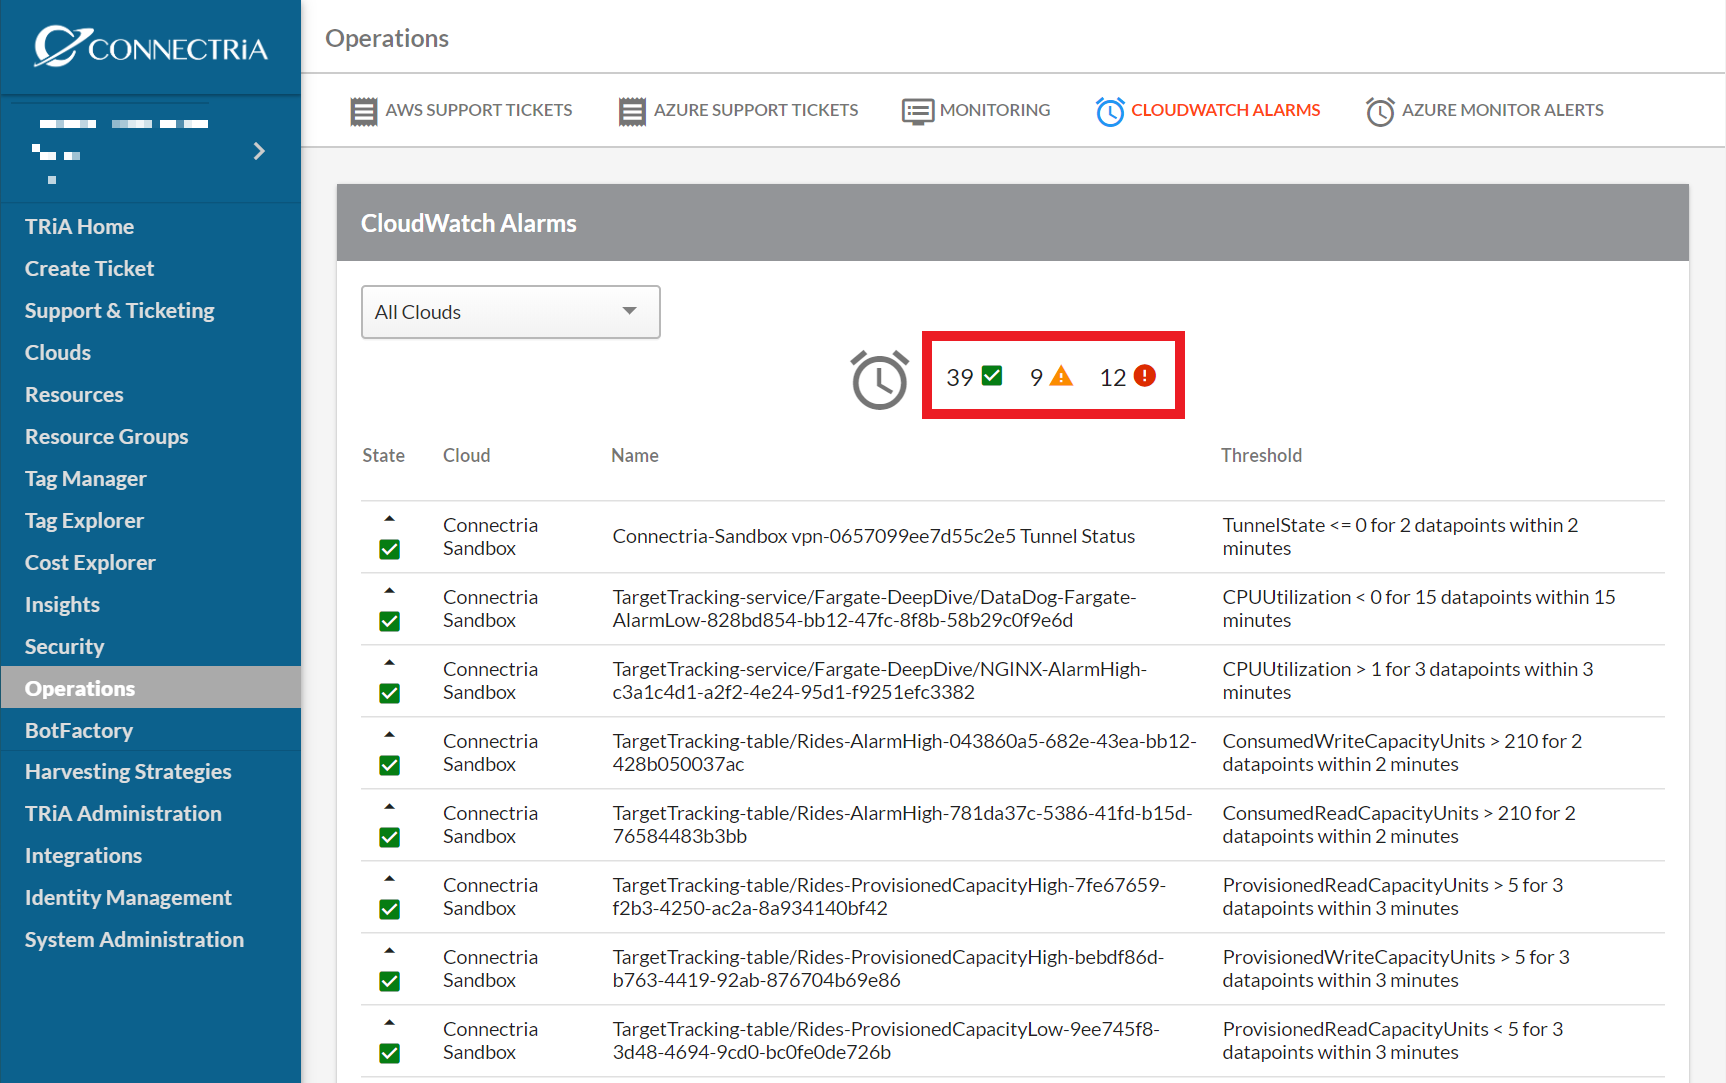
Here, users can see information regarding each alarm, including:
The current status of the alarm
The cloud account the alarm is linked to.
The name of the alarm.
The threshold logic for which the alarm will set itself off.
You can also filter your alarms by their state by clicking on the corresponding status icon at the top of the table.
Note
Alarms with the yellow Insufficient Data state, might not have been properly configured in AWS.
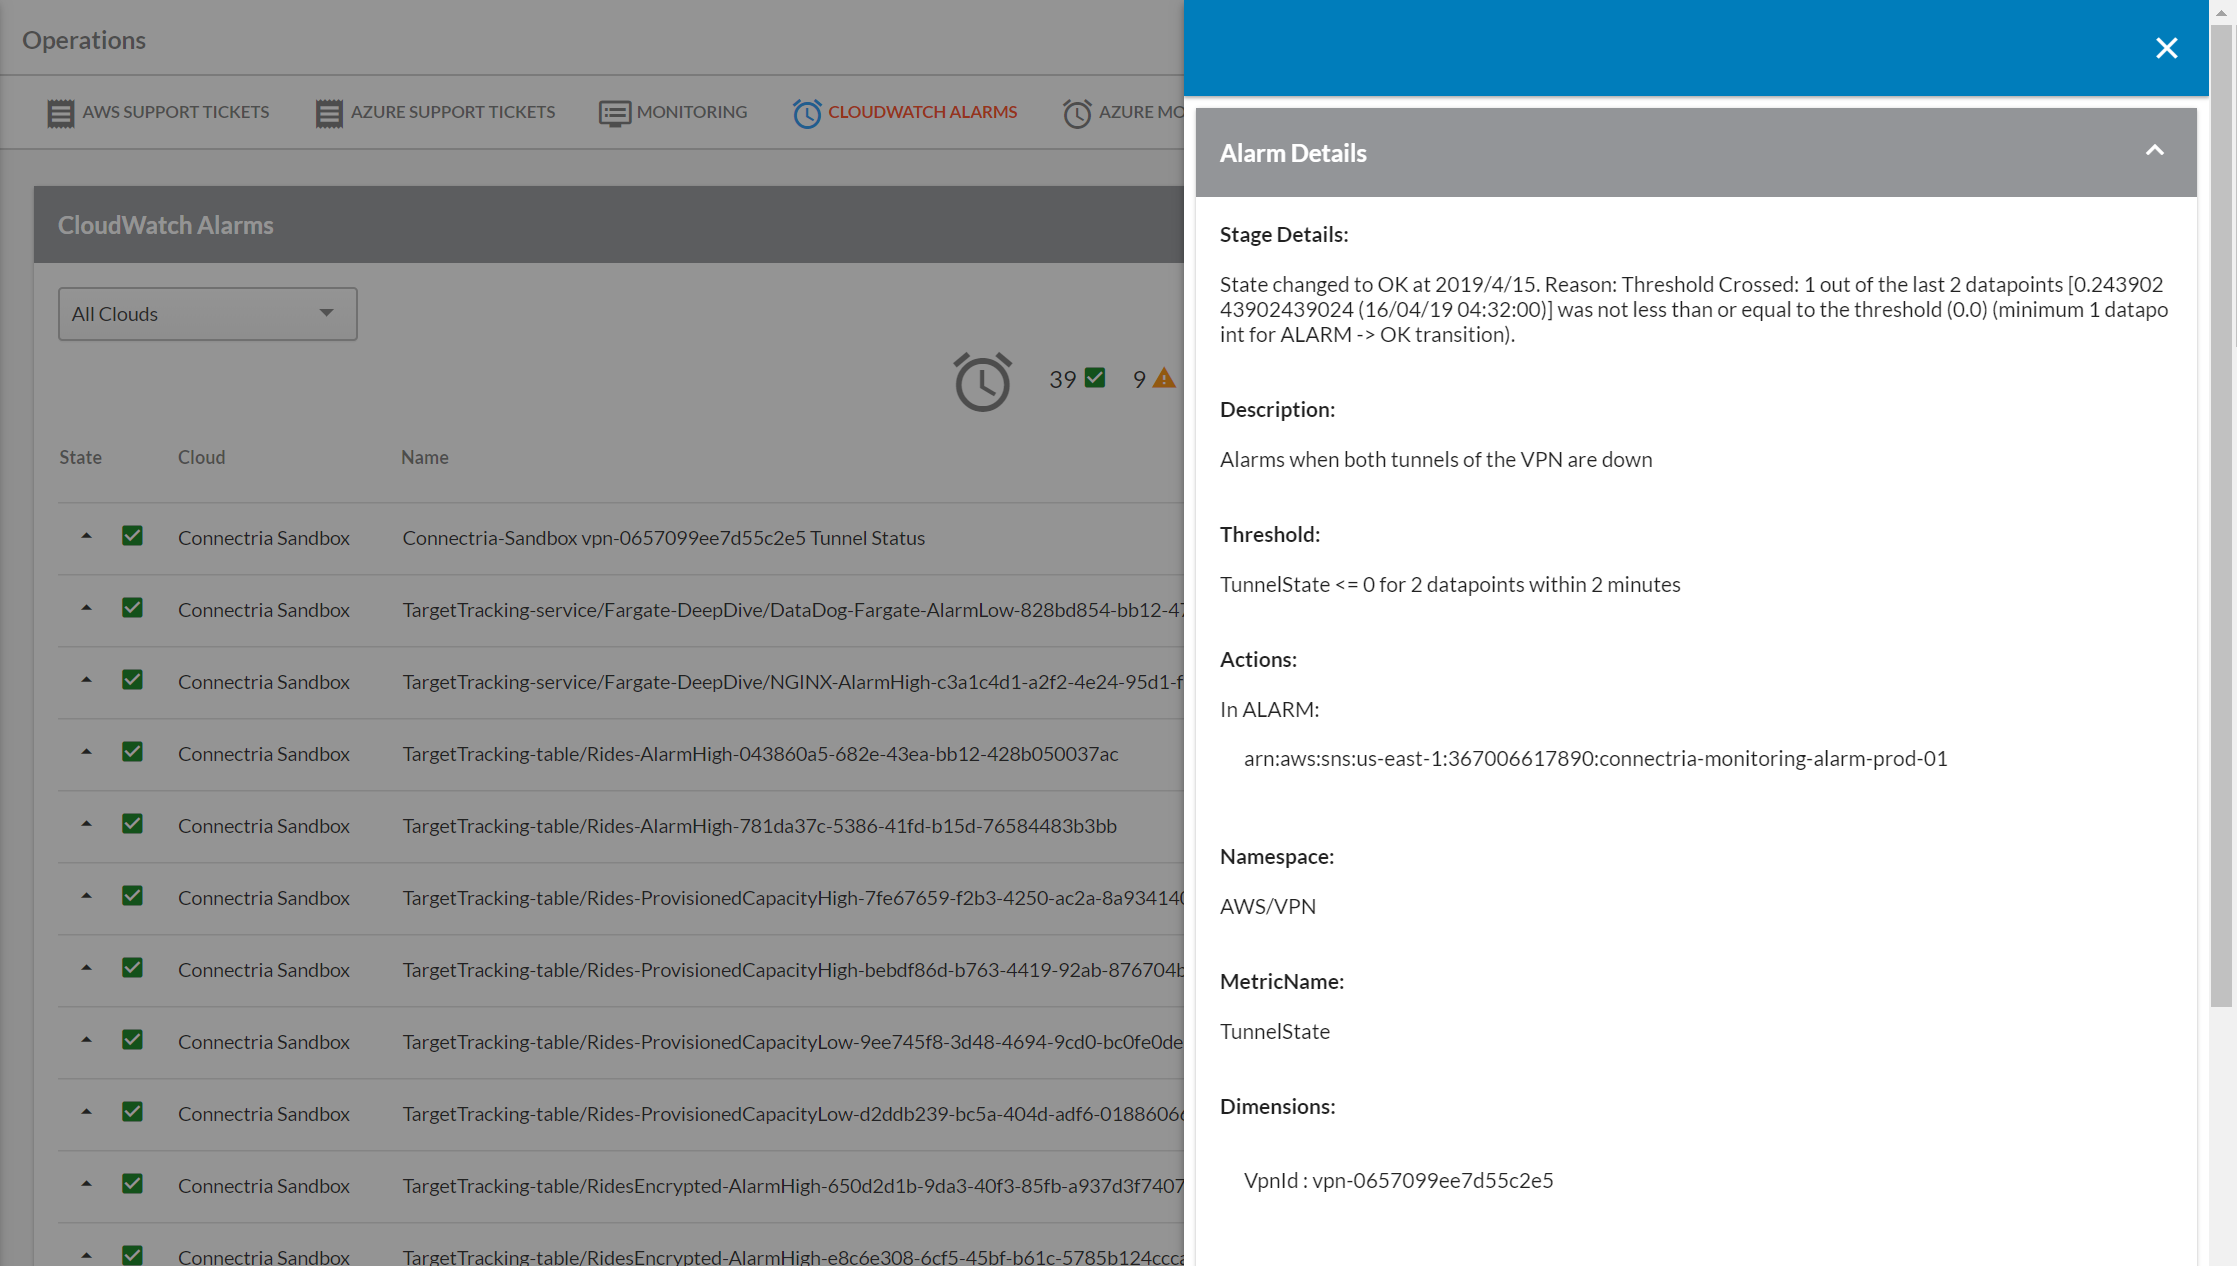
You can also see the details of each alarm, such as the affected resource, a short description of the alarm, and more, by clicking on that alarm in the table.
Azure Monitor Alerts
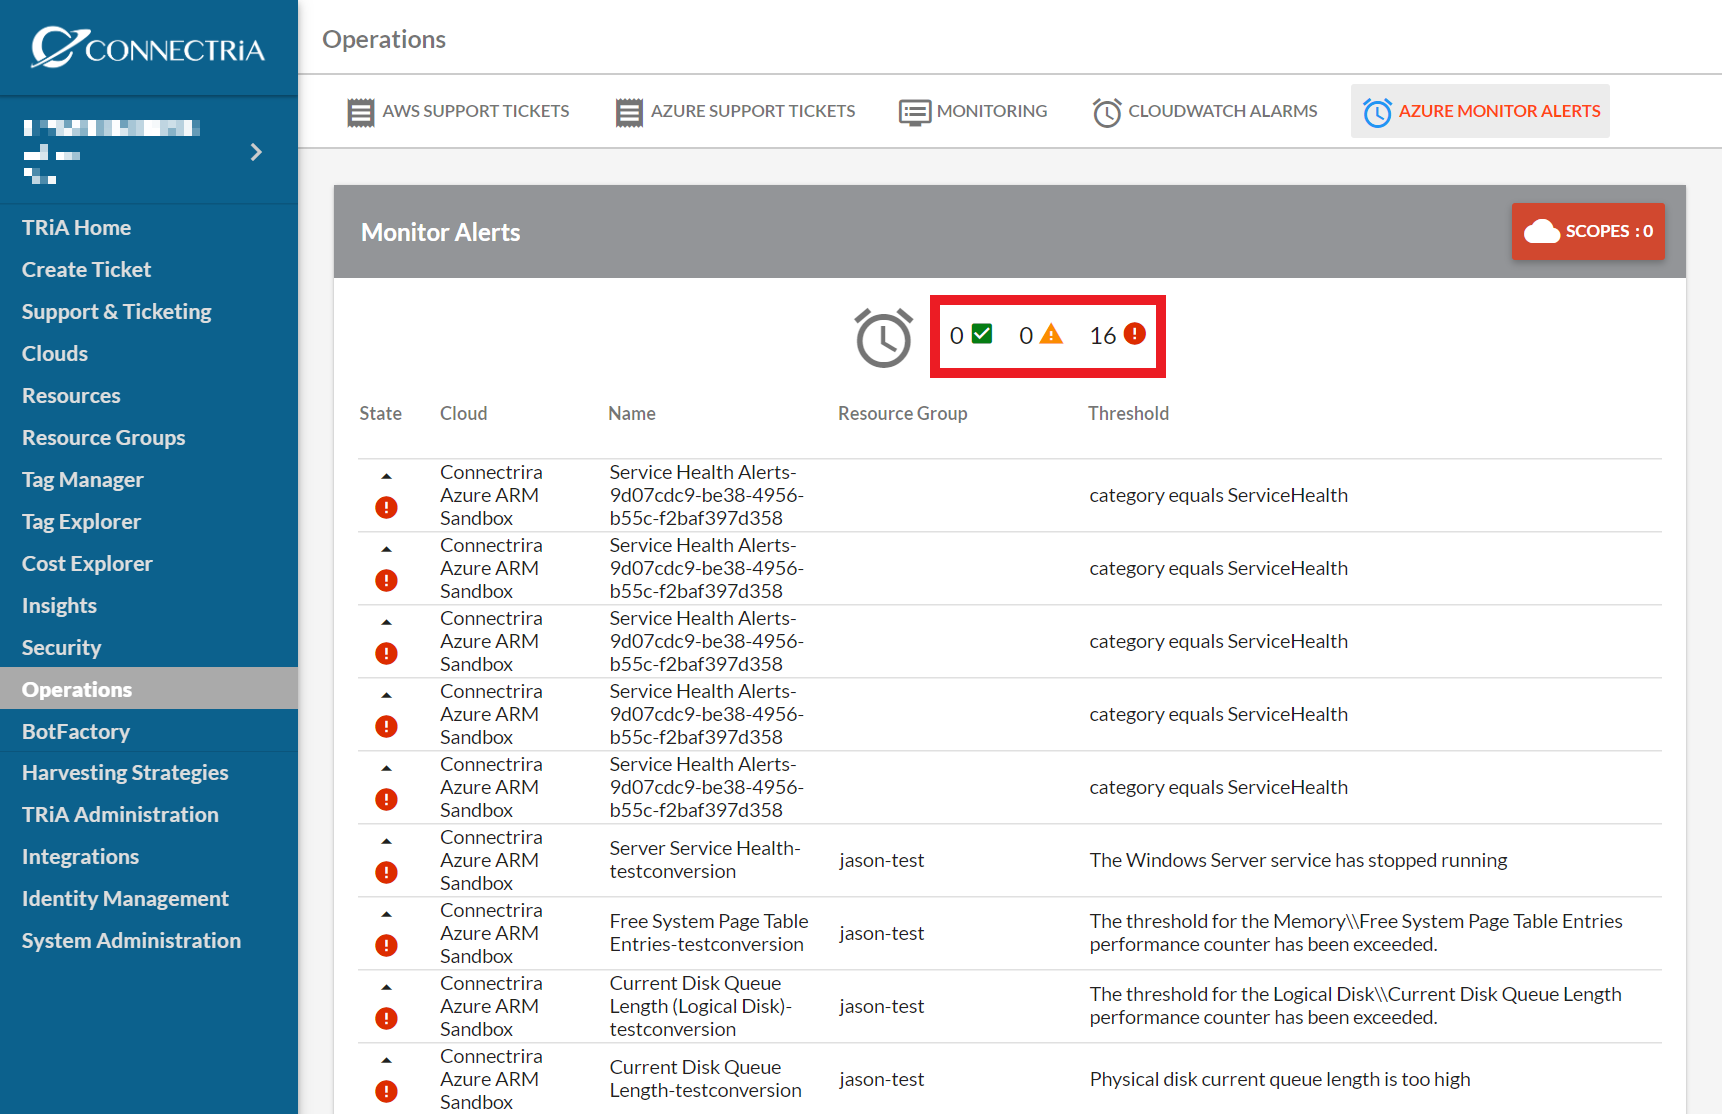
The Azure Monitor Alerts tab displays the alerts for your Azure clouds created from your Azure account(s).
The current status of the alert
The cloud account the alert is linked to.
The name of the alert.
The threshold logic for which the alert will set itself off.
You can also filter your alerts by their state by clicking on the corresponding status icon at the top of the table.
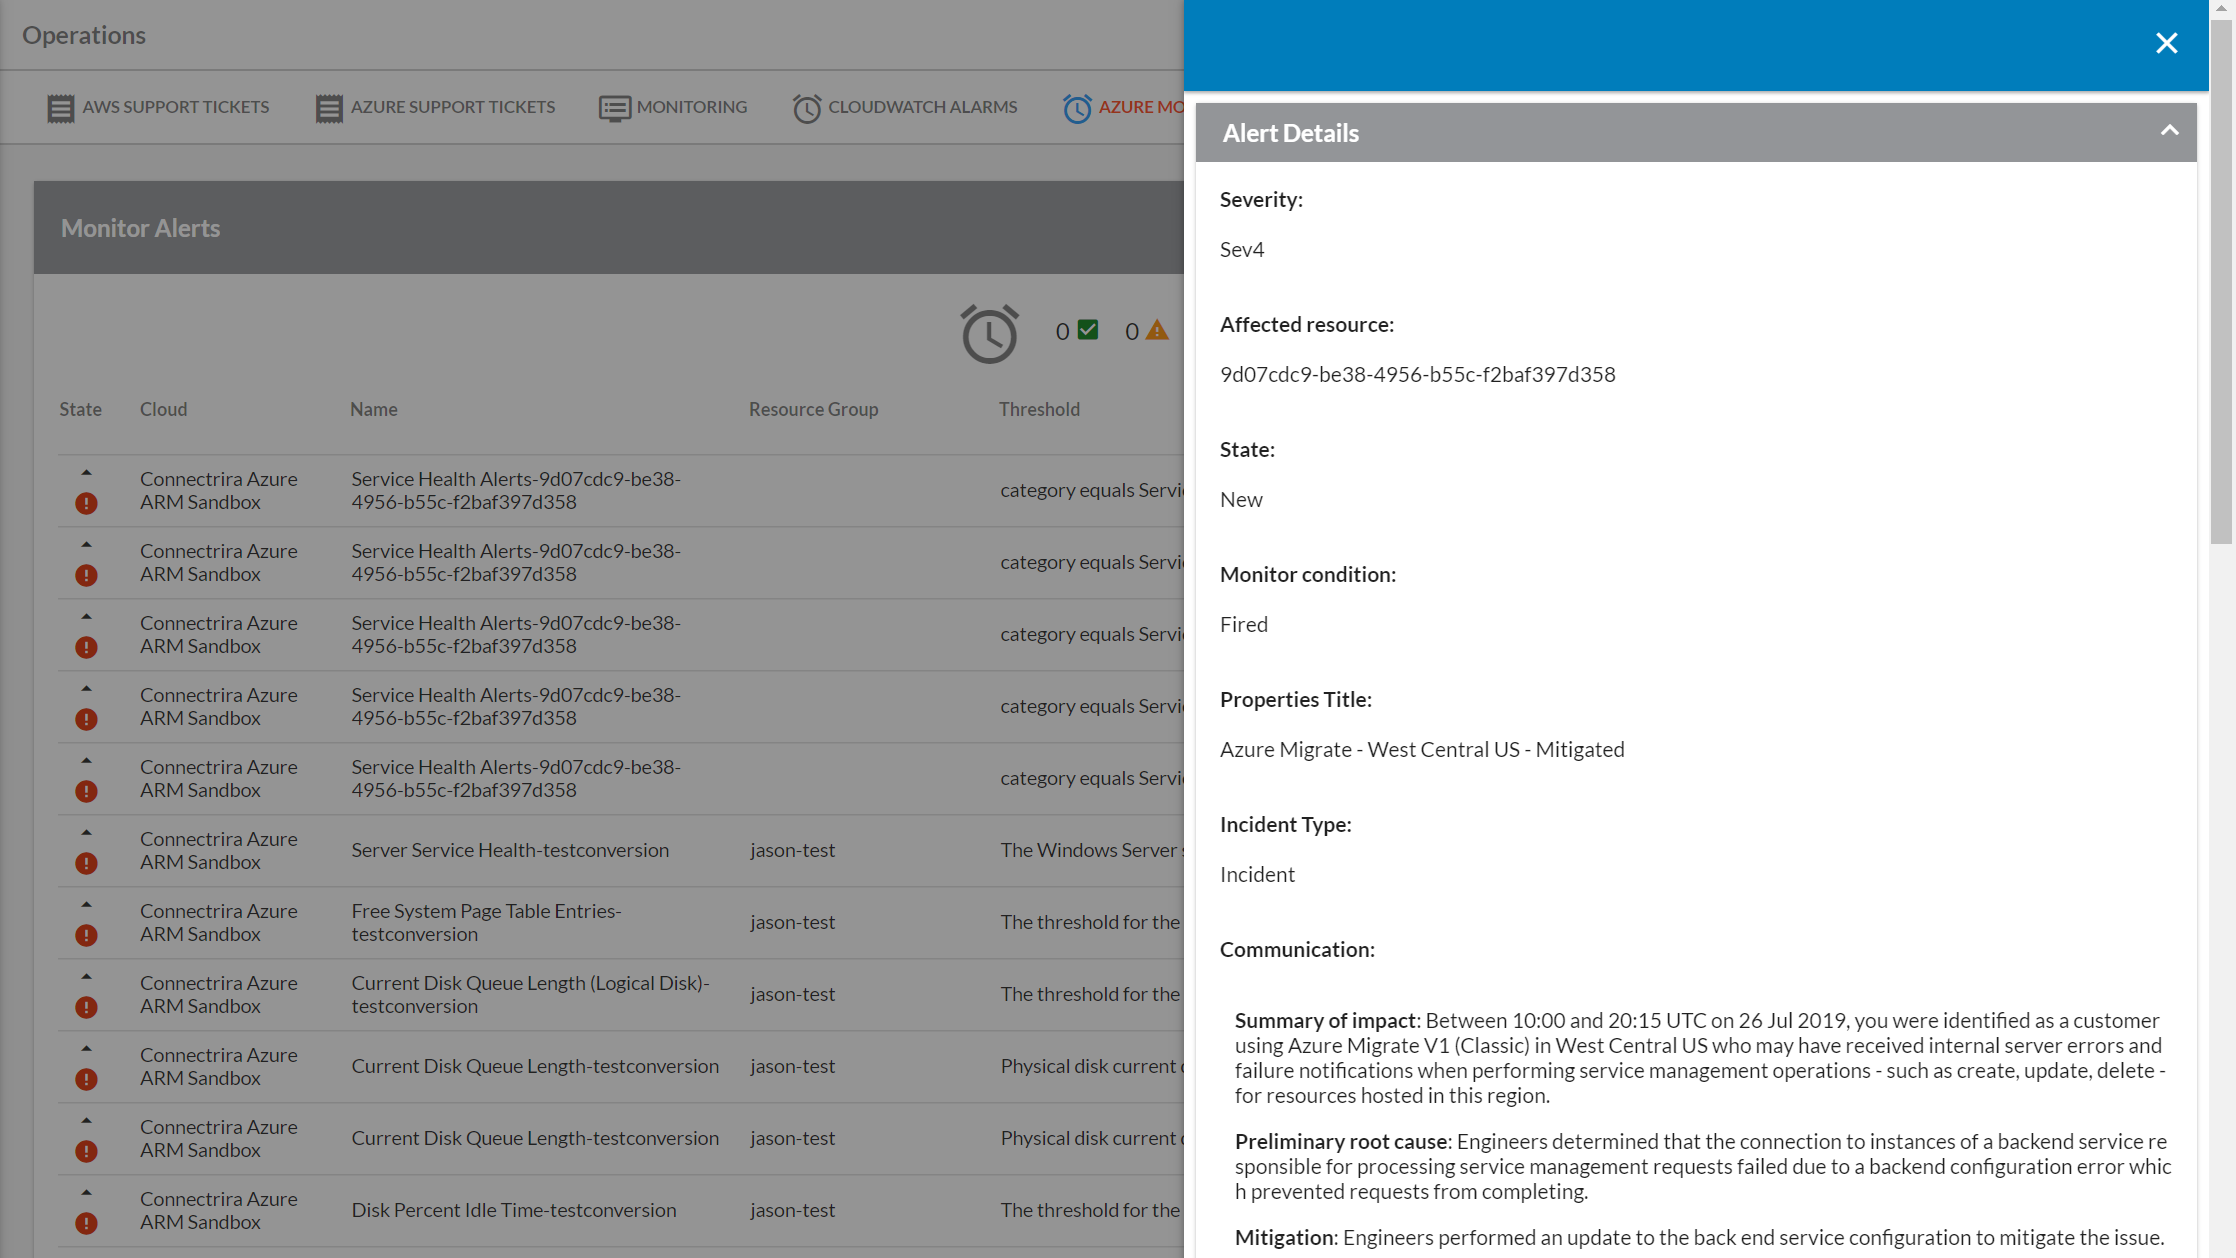
You can also see the details of each alert, such as the affected resource, a summary of the impact and cause, and more, by clicking on the desired alert in the table.
Toubleshooting
If the CloudWatch Alarms page does not display any alarms, you may still need to set up your alarms in AWS. To get started doing so, please visit Using Amazon CloudWatch Alarms.
Similarly, to get started with Azure Monitor Alerts, please visit Using Azure Monitor if you have not yet set up your alerts in Azure.